
Plotr est une solution très intéressante pour faire des graphiques dynamiquement dans une page web. Ce script fonctionne dans
- Firefox 1.5+
- Safari 2.0+
- Opera 9.0+
- IE6+
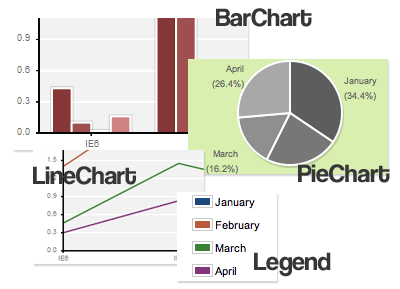
Image : Solutoire.com, Plotr. Copie d’archive (Wayback Machine).

L’api est assez simple, voici un exemple pour faire un camembert :
// Define a dataset.
var dataset = {
	'myFirstDataset' : 	[[0, 3], [1, 2], [2, 1.414], [3, 2.3]],
 	'mySecondDataset' : 	[[0, 1.4], [1, 2.67], [2, 1.34], [3, 1.2]],
 	'myThirdDataset' : 	[[0, 0.46], [1, 1.45], [2, 1.0], [3, 1.6]],
 	'myFourthDataset' : 	[[0, 0.3], [1, 0.83], [2, 0.7], [3, 0.2]] };
// Define options.
var options = {
// Define a padding for the canvas node
   	padding: {left: 30, right: 0, top: 10, bottom: 30},
// Background color to render.
   	backgroundColor: '#f2f2f2',
// Use the predefined blue colorscheme.
   	colorScheme: 'blue',
// Set the labels.
   	xTicks: [
 		{v:0, label: 'January' },
       	        {v:1, label: 'Februari' },
       	        {v:2, label: 'March' },
       	        {v:3, label: 'April' }
       	            ] };
// Instantiate a new PieCart.
var pie =  new Plotr.PieChart ( 'pie1' ,options ) ;
// Add a dataset to it.
pie.addDataset ( dataset ) ;
// Render it.
pie.render();